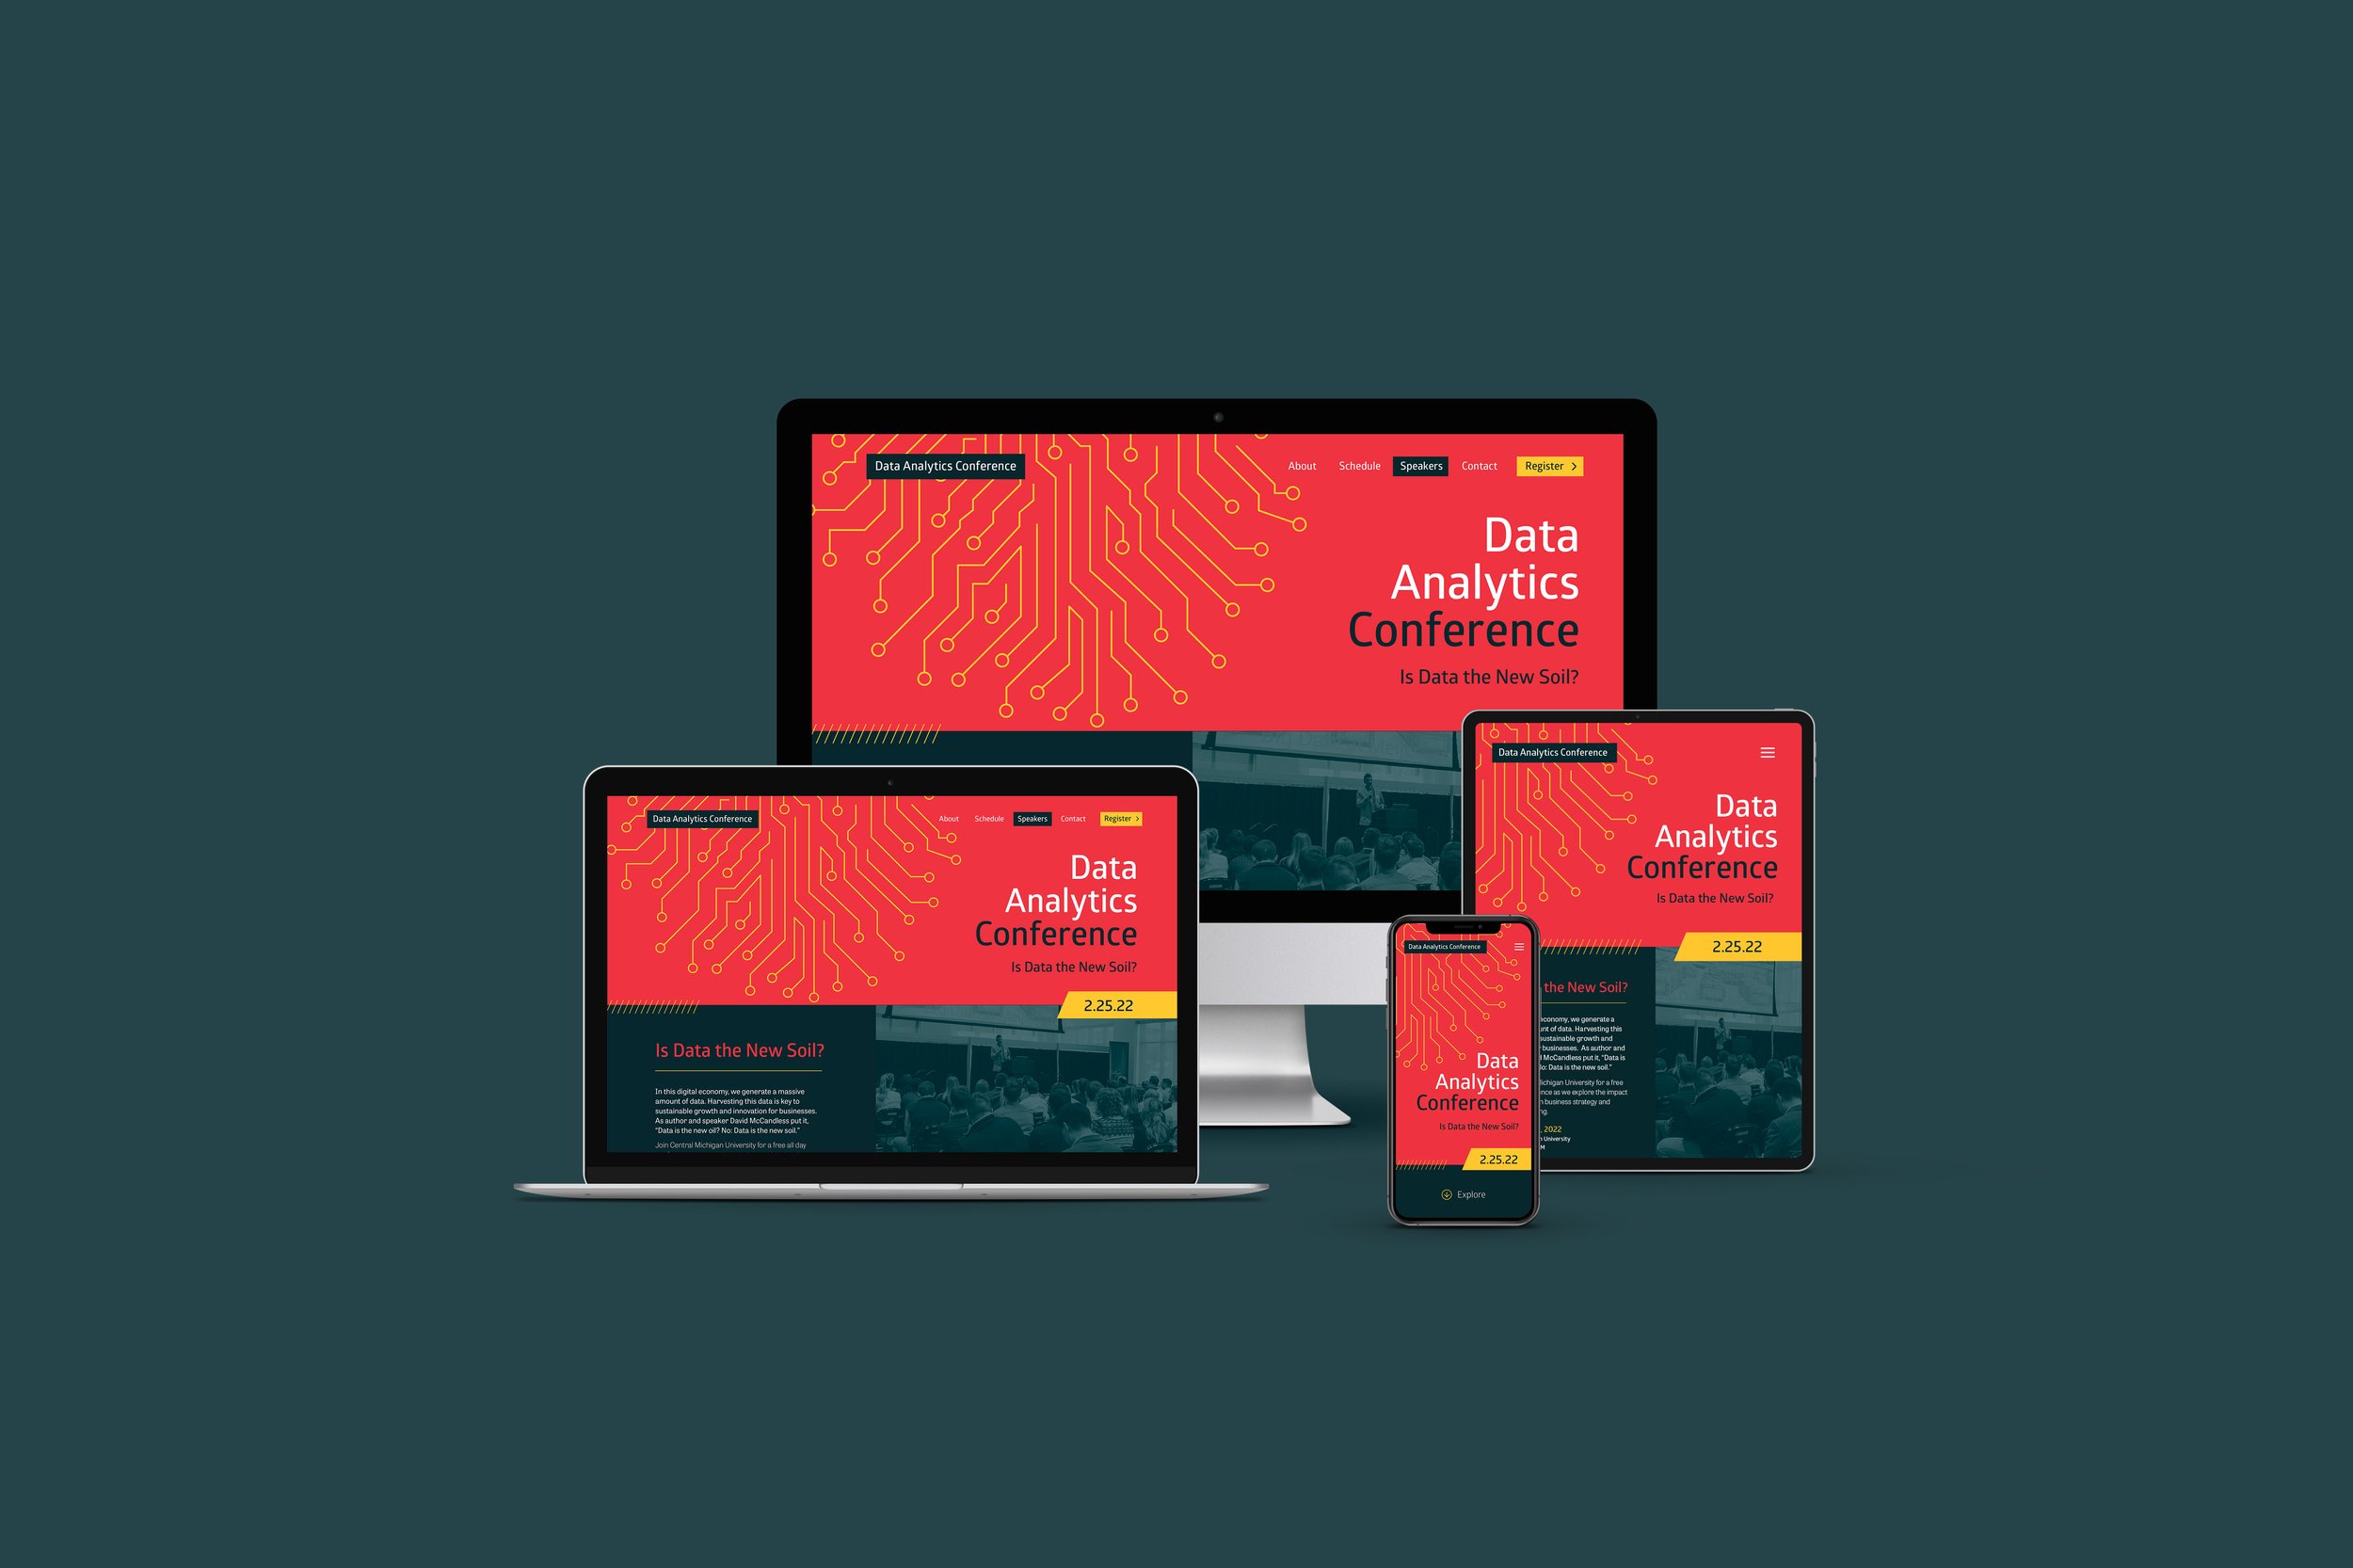

DATA ANALYTICS CONFERENCE
The Data Analytics Conference was a special event that was supposed to take place at Central Michigan University. However, the pandemic and numerous scheduling issues caused its cancelation. I used this opportunity to develop and design something outside the standard CMU brand guidelines.
Tired of using maroon and gold, I swapped it out for a dark greenish blue and bright shades of red and yellow. This electrifying color pallet fused perfectly with the modern sans-serif typeface and dynamic lines.
The theme of the event was “Data is the New Soil,” a statement made by David McCandless in his 2010 TED Talk. McCandless describes data as a fertile and creative medium. It can be irrigated, worked, and tilled. To bloom, it must establish durable roots that support infrastructure and a strong flow of information.
Inspired by the importance of roots, I created a tree that grows from an intricate data system. The tree’s roots are sharp solid lines with circled tips that collect and store data. As it flows up the tree, the lines become organic with slight bends and curves. The leaves blossom with data for the viewer to explore.
Project
Data Analytics Conference
Client:
Business Information Systems Department, Central Michigan University
Role:
Brand & Identity Design, User Experience & Web Design


UX & Web Design
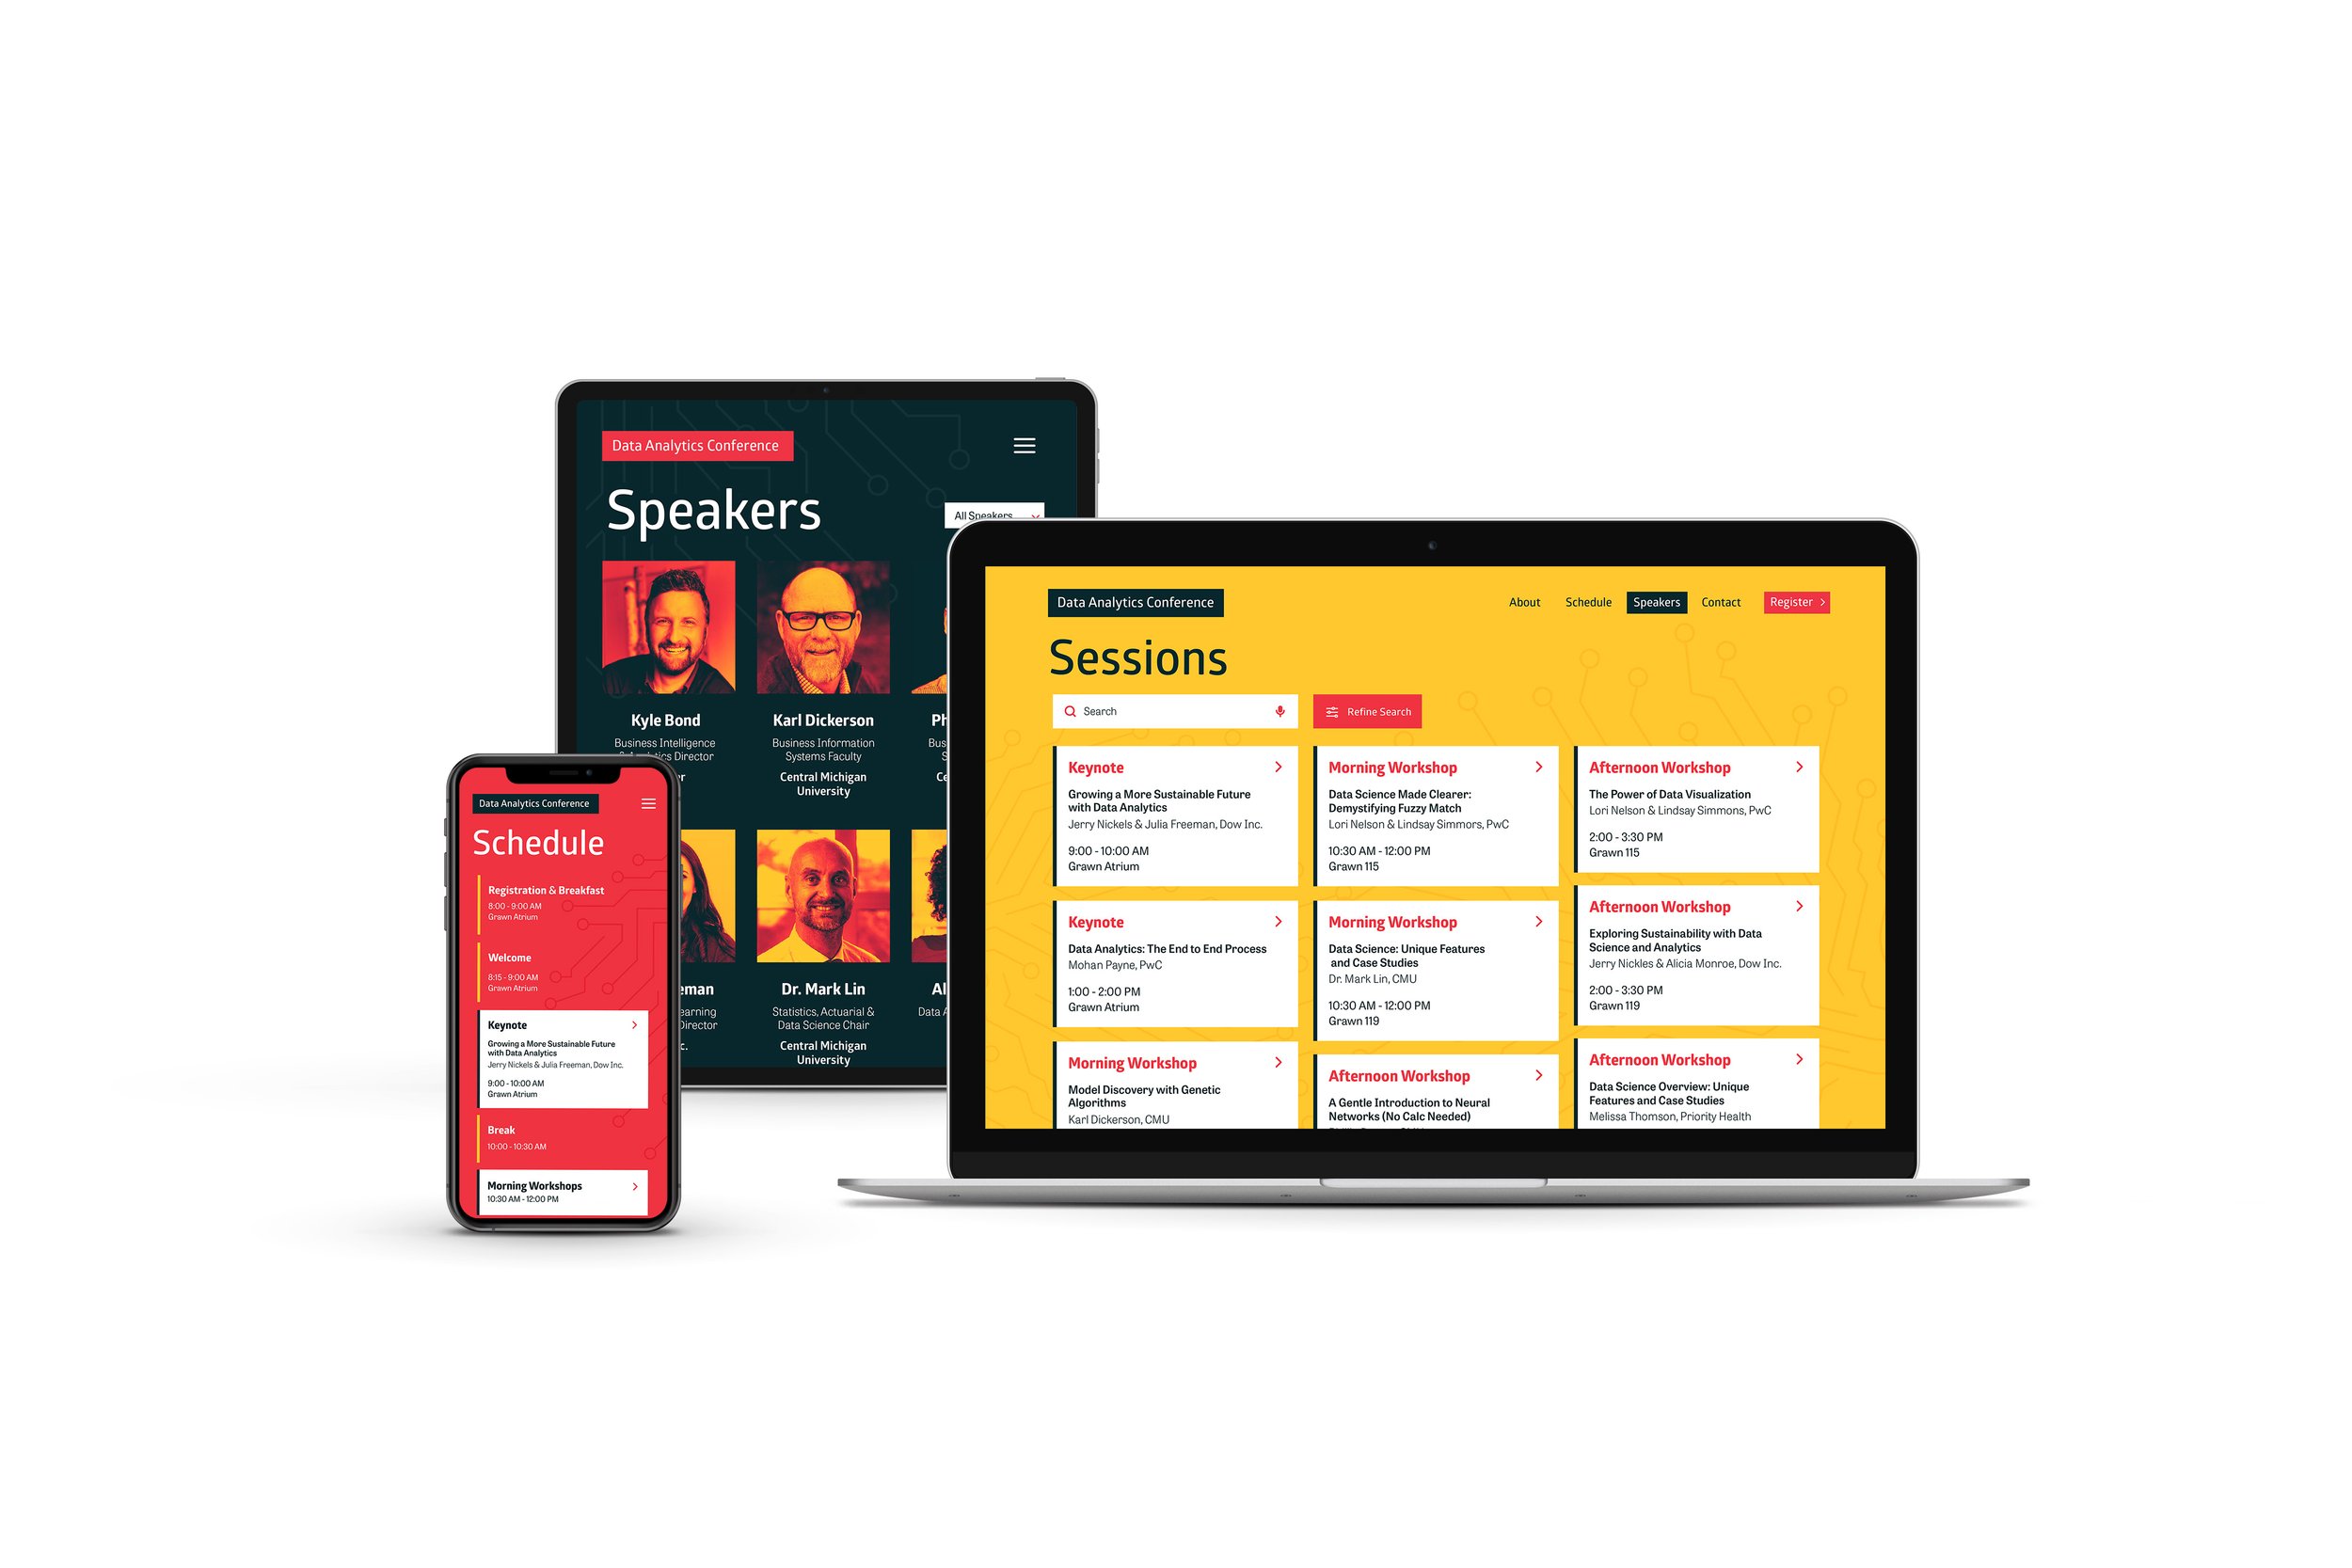
I built a unique and enjoyable user experience for the conference website. I started by focusing on three users; students, faculty, and professionals. From observing the users, I quickly discovered that students needed two different categories. First and second-year students were more likely to attend the conference because it was required or extra credit. Juniors, seniors, and graduate students attended because they wanted to. They saw this as an opportunity to learn about the industry and find jobs or internships.
User Profiles
-
Name: Blake Roberts
Gender: Male
Age: 18
Occupation: Freshman College Student, Undecided Major
Location: Lives on campus in a residential hall
_______________________________
Background:
Blake is currently getting a ‘B-’ in his Intro to Business Class. If he attends the Data Analytics Conference and writes a one-page paper, his professor will grant him extra credit. The conference will be in the building where Blake takes his business class. He knows how to get to his classroom. However, he isn’t familiar with the rest of the building and may need help locating the sessions.
_______________________________
Goals:
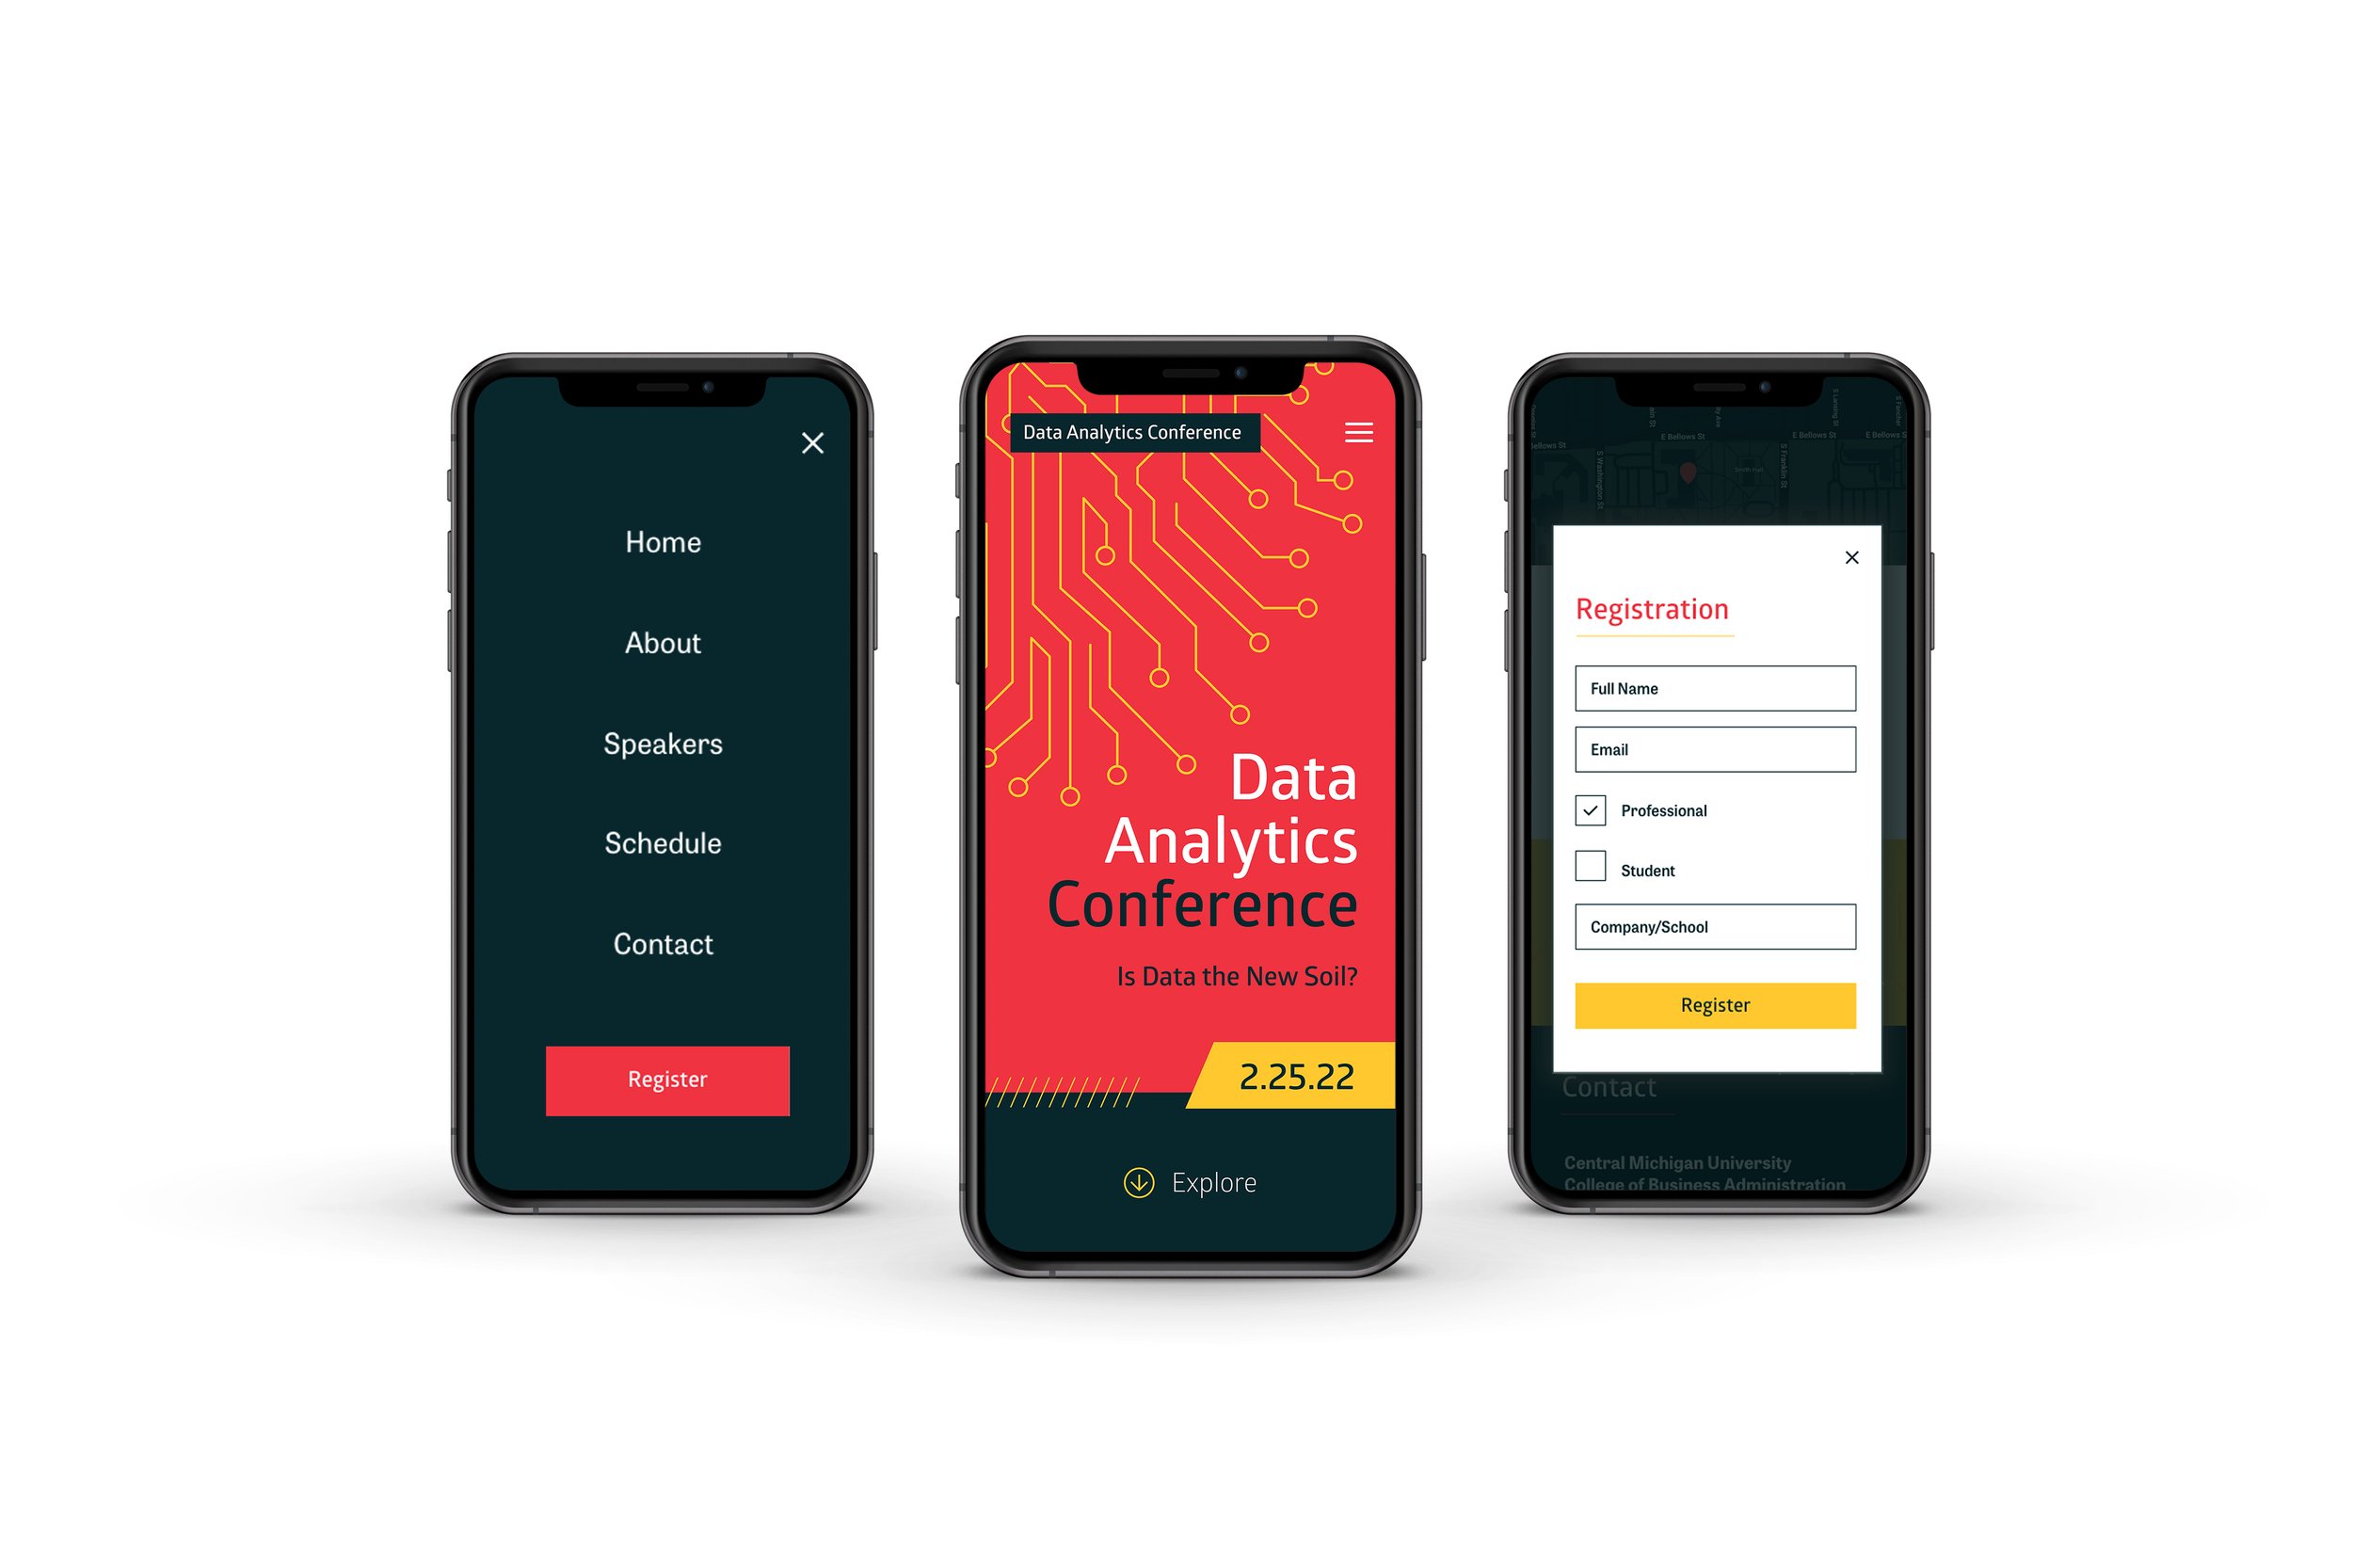
Quickly and efficiently register for the event
Find basic information such as the date and time
Locate the sessions that he plans on attending
Needs:
Registration is easy to find and is quick to fill out
Essential information is promptly displayed
Map of the building with specific sessions and times
-
Name: Maddison Davis
Gender: Female
Age: 20
Occupation: Junior College Student, Information Systems Major, Cybersecurity Minor
Location: Lives off-campus in an apartment
_______________________________
Background:
Maddison is looking for a summer internship to add to her resume. At the conference, she plans on networking with speakers and other professionals. She also wants to learn more about the industry and looks forward to the various sessions. Maddison is very familiar with the layout of the building. She will not need any assistants locating the sessions.
_______________________________
Goals:
Discover event speakers and connect with them after the event
Pick the sessions that would be most valuable for networking
Needs:
List of speakers that includes positions, companies, biographies, and contact information
Schedule of the sessions that provides speaker information and a short description
-
Name: John Stevens
Gender: Male
Age: 52
Occupation: Tenured Faculty, Business Information Systems Department
Location: Lives in town with his wife and two kids
_______________________________
Background:
John has required his students to attend the Data Analytics Conference and write a one-page paper on what they learned. As a professor, he likes to familiarize himself with industry trends and innovations. John also plans to network with speakers and professionals to form corporate alliances with the university. John is extensively familiar with the building because he has taught there for over a decade. He will have no issues locating the sessions.
_______________________________
Goals:
Learn about the sessions and select the ones most relevant for his students
Have a basic understanding of the topics covered for grading purposes
Identify speakers to network and connect with
Needs:
List of sessions with a search engine that sorts by topic, time, and speaker
Short descriptions of each session that includes topics of discussion and who will be speaking
List of speakers that consists of positions, companies, biographies, and contact information
-
Name: Alexandra Moore
Gender: Female
Age: 28
Occupation: Analysts at a systems software company
Location: Lives in an apartment in Grand Rapids, MI
_______________________________
Background:
At the Data Analytics Conference, Alexandra will present the new software and technology her company has designed and network with fellow analysts. Alexandra is driving to campus from Grand Rapids. She is unfamiliar with the university and will need help navigating to campus and locating her session.
_______________________________
Goals:
Find where the conference is taking place and how to navigate to it
Locate the classroom she will be presenting in
Browse her fellow speakers and learn what topics they are discussing
Needs:
Navigational map to campus and clear directions to the building and parking
Map of the building with specific sessions, times, and speakers
List of speakers with a description of their presentations


Print Design
Square cards would be distributed on campus and in classes to promote the conference. The cards were simple, featuring the data tree on the front and a short description on the back with a QR code that led to the conference website.
The name tags were color-coded for easy differentiation. Speakers had a blue badge with a red bar; attendees’ badges featured a yellow bar that specified student or professional. Staff badges are bright red and designed to stand out among the crowd. If an attendee or speaker had an issue or a question, they could easily spot a helpful staff member.
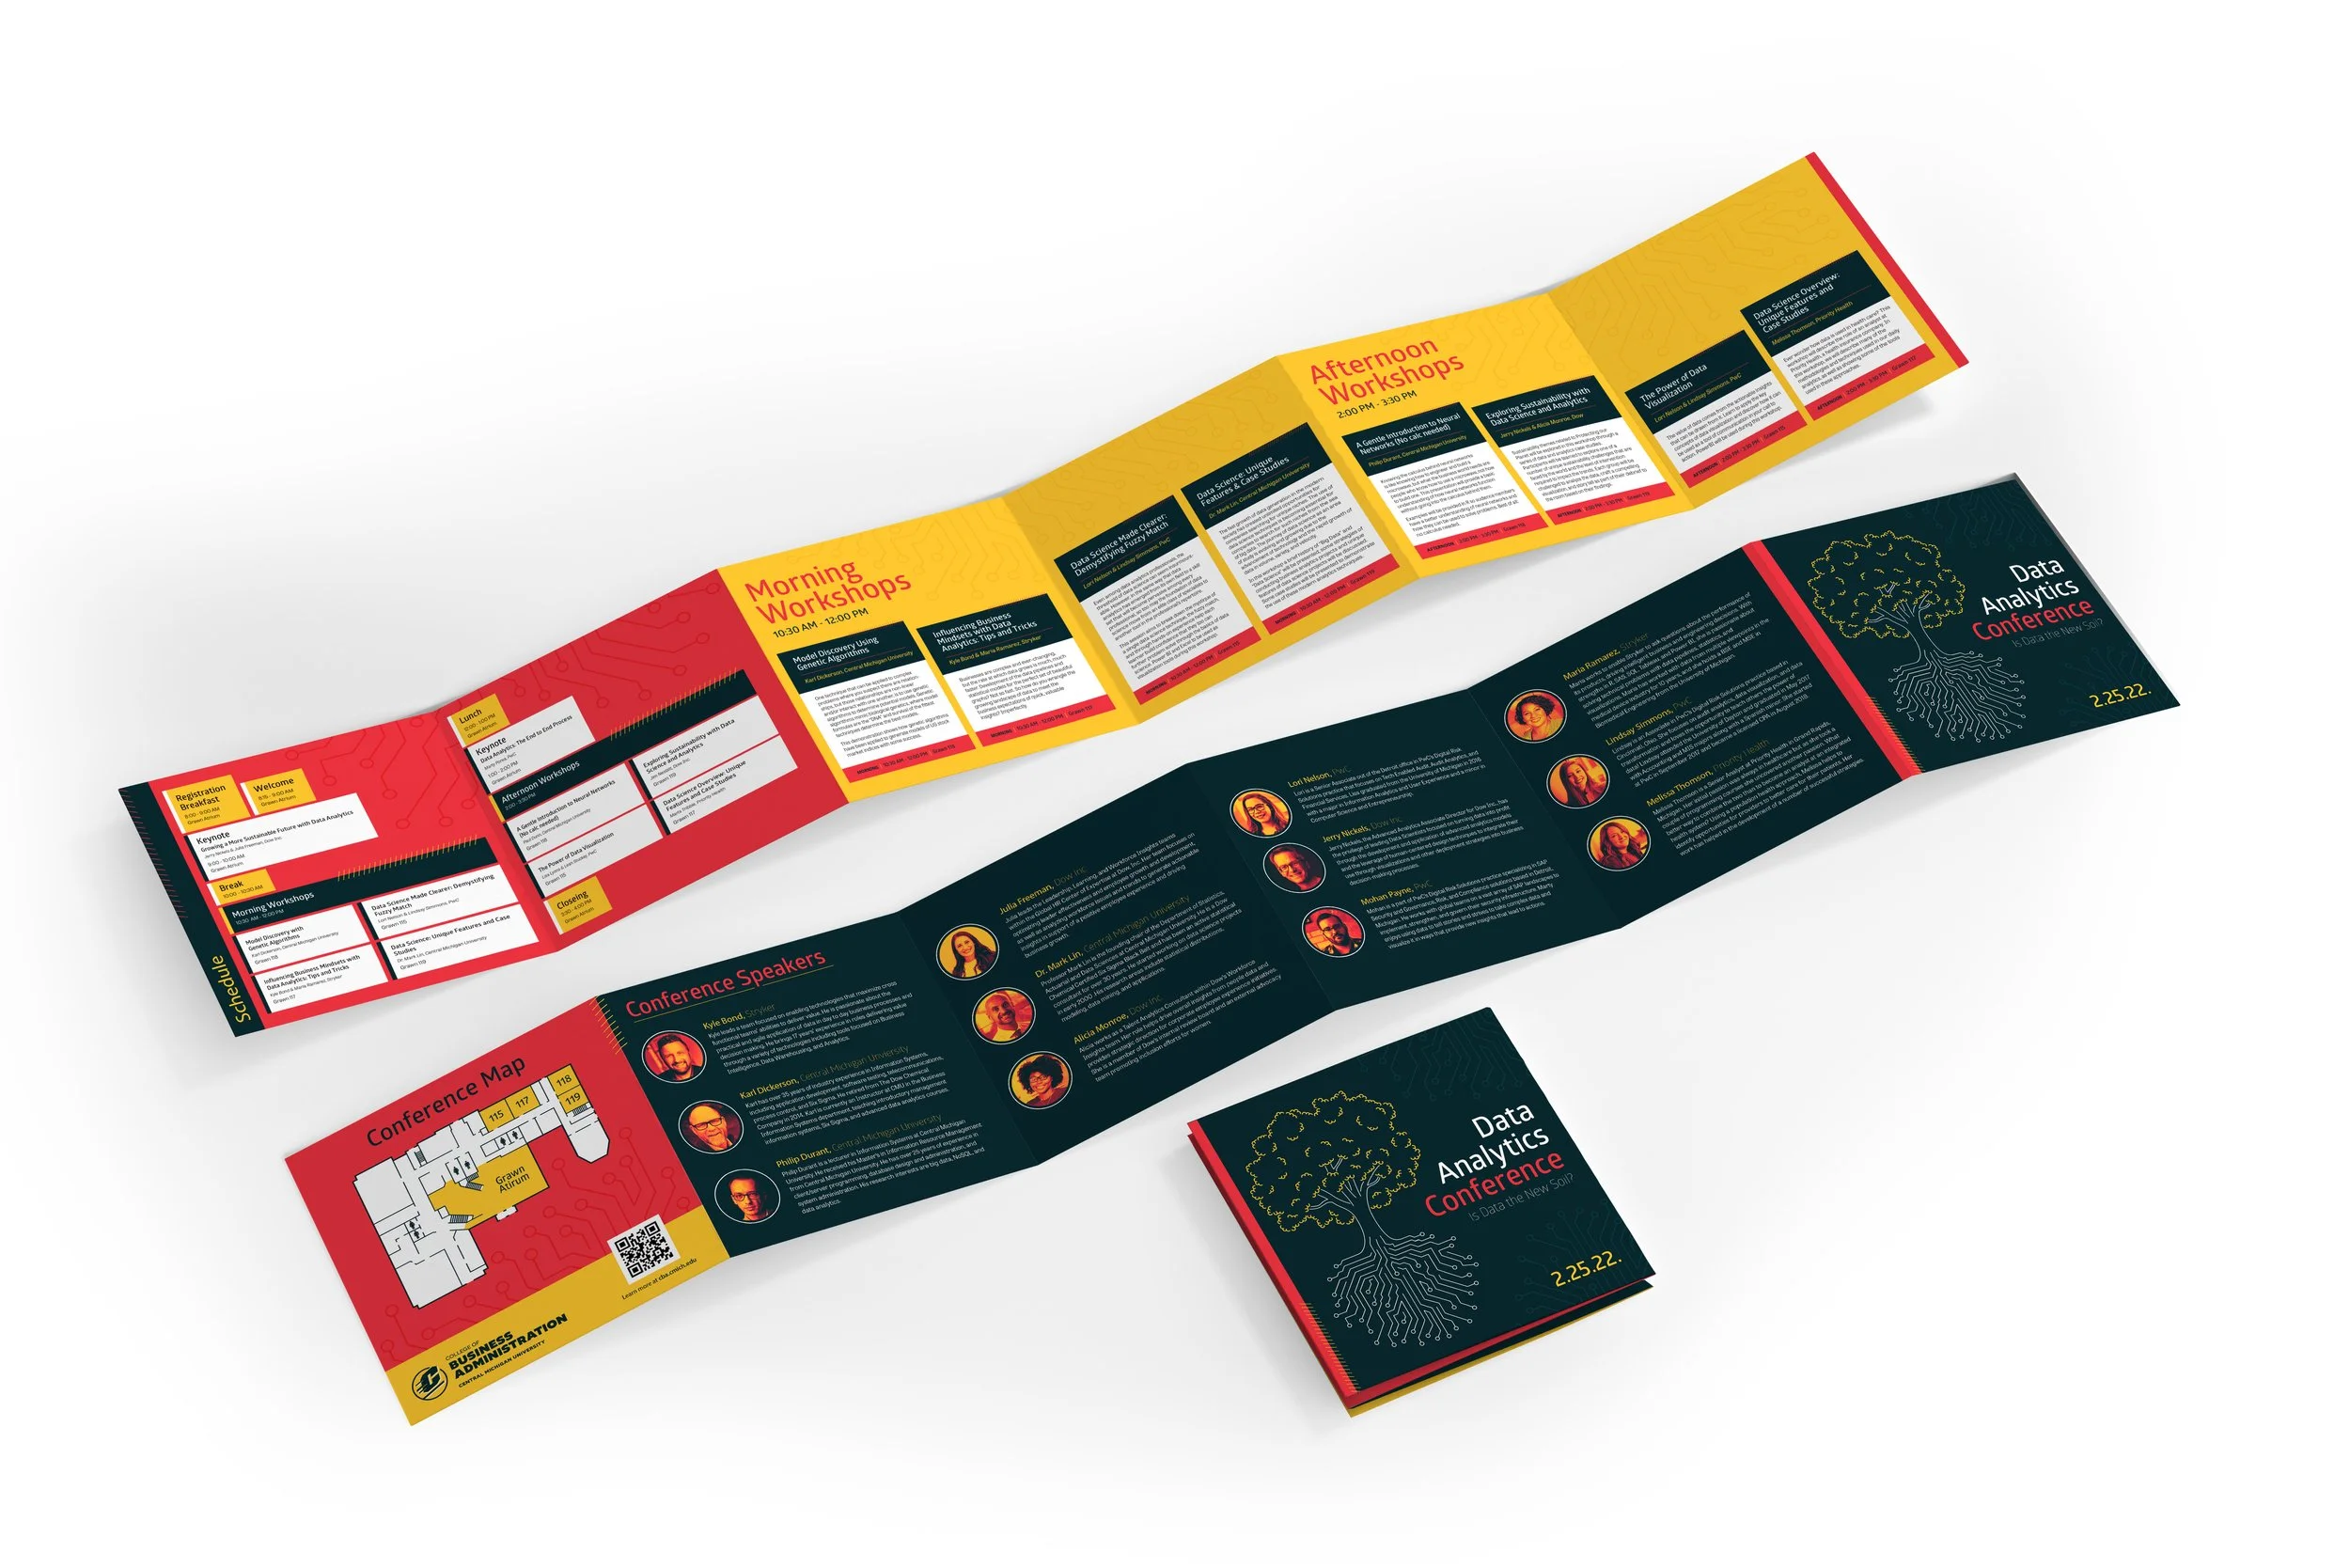
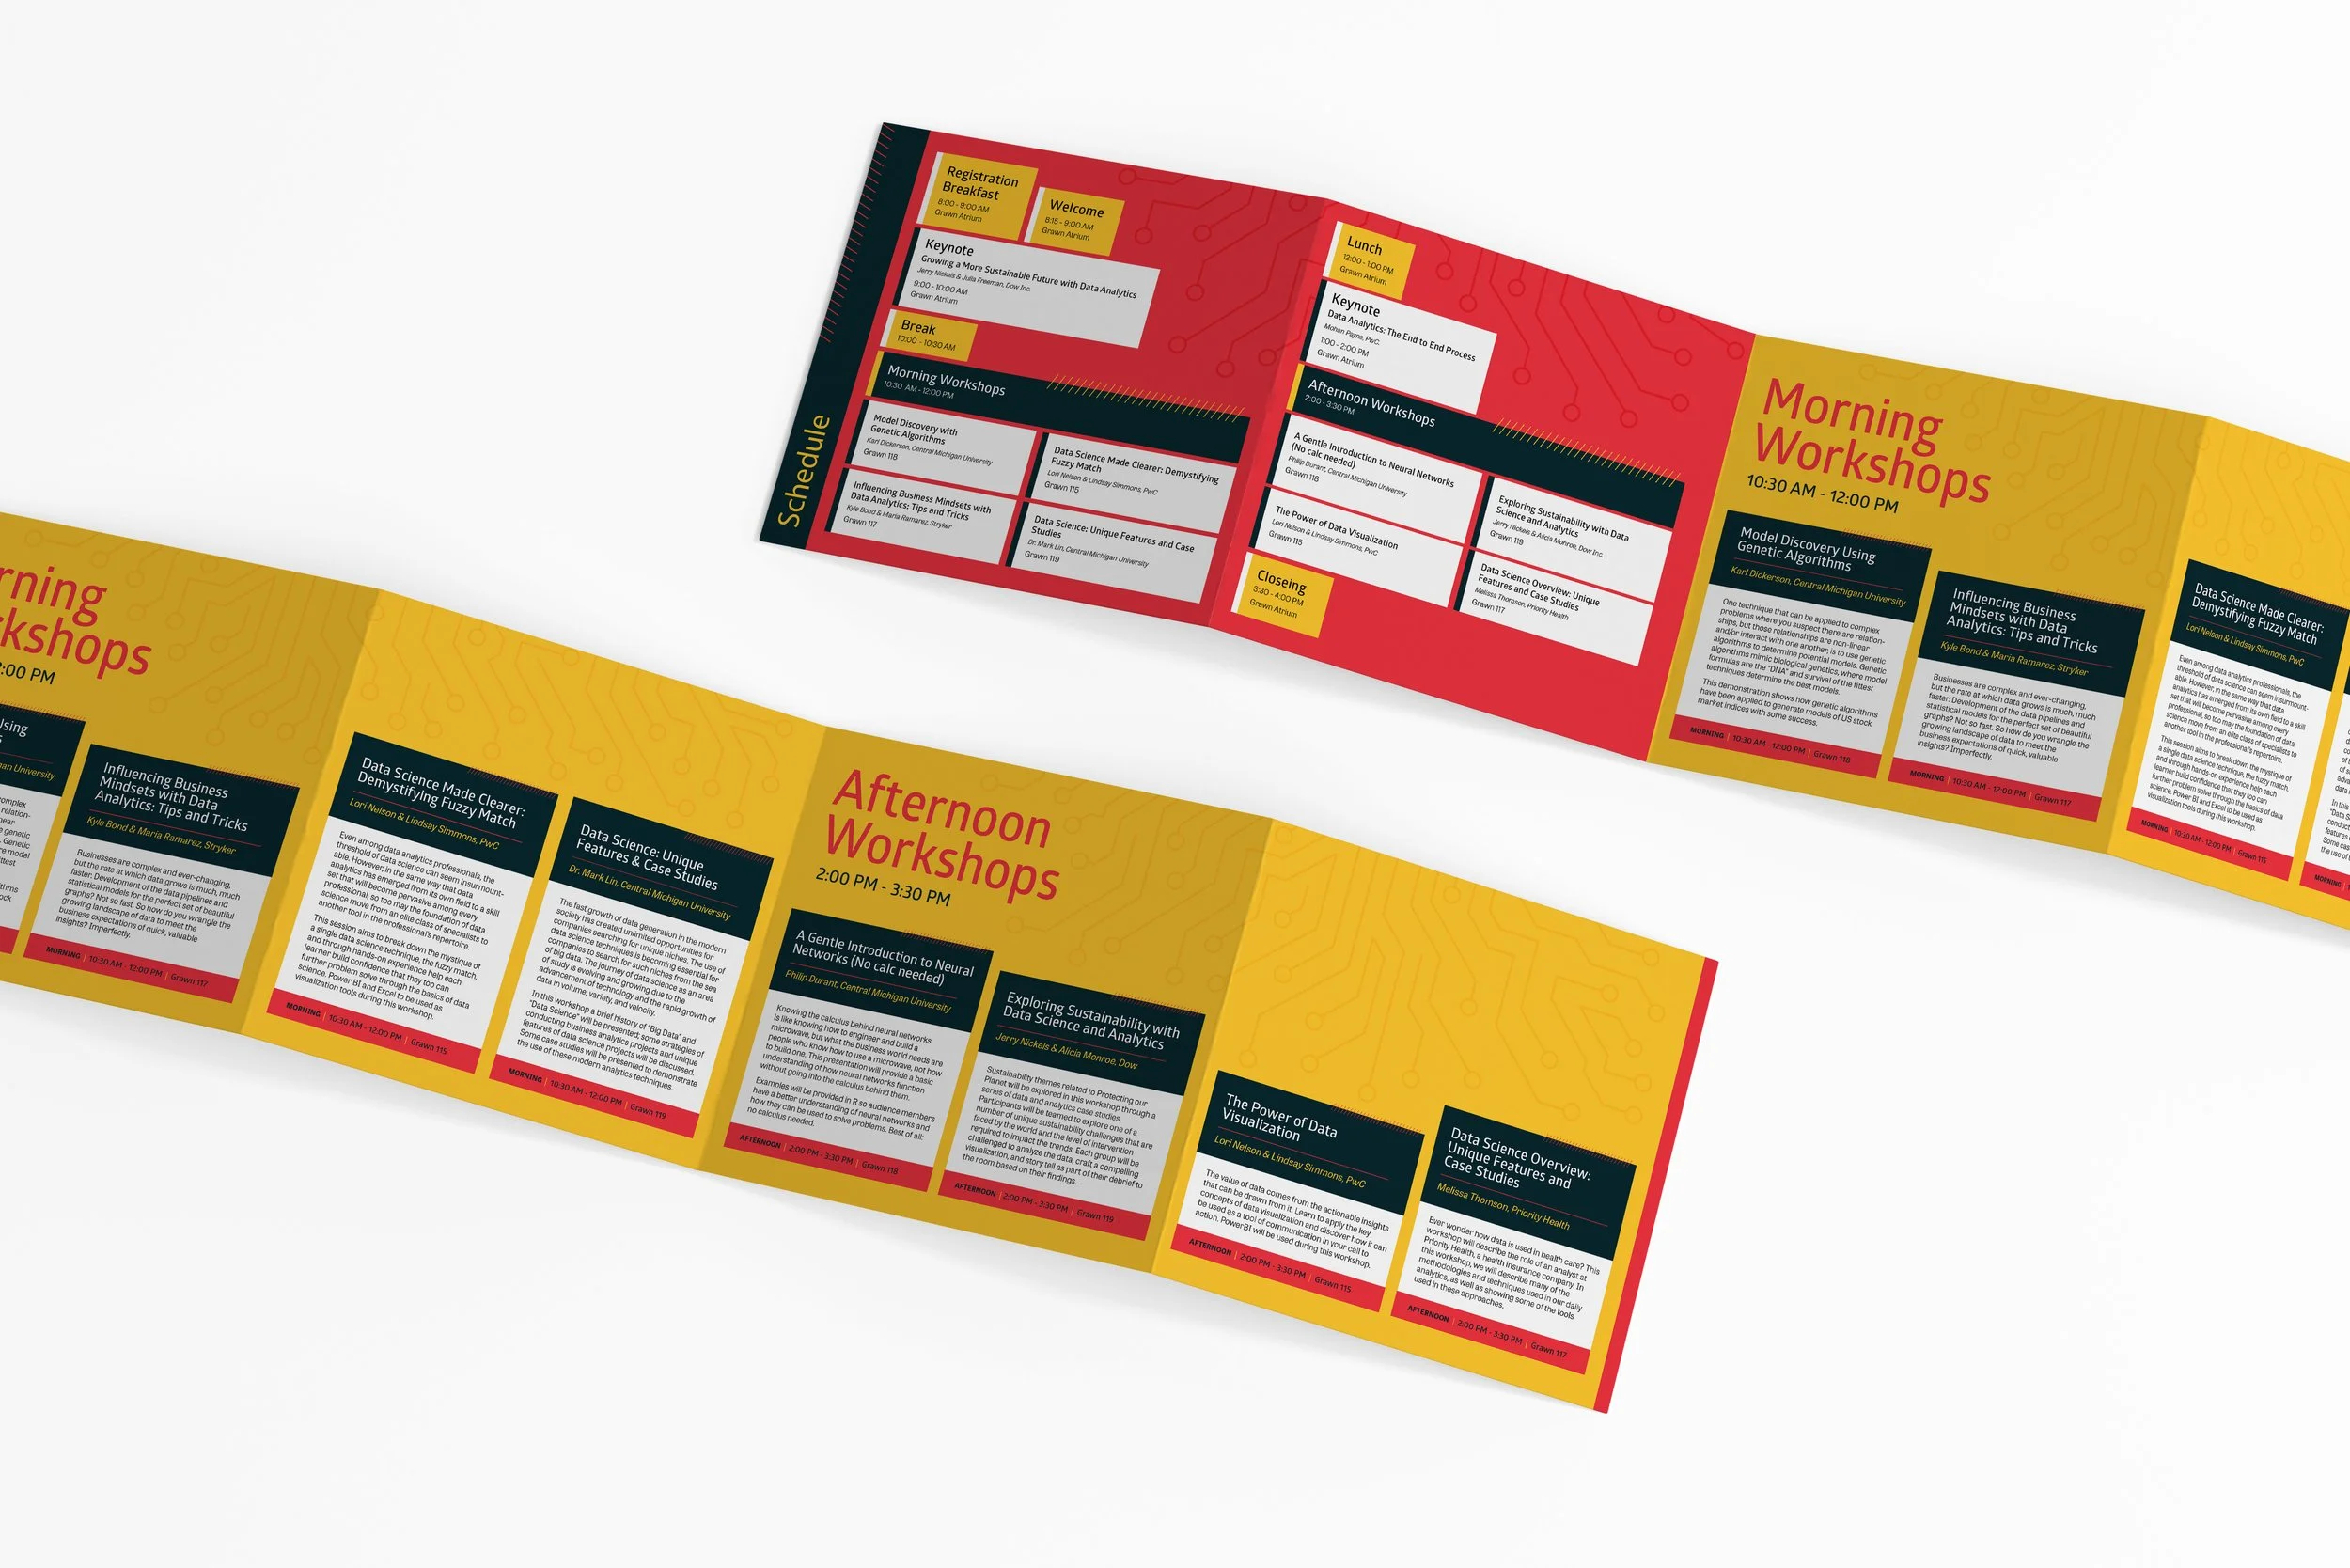
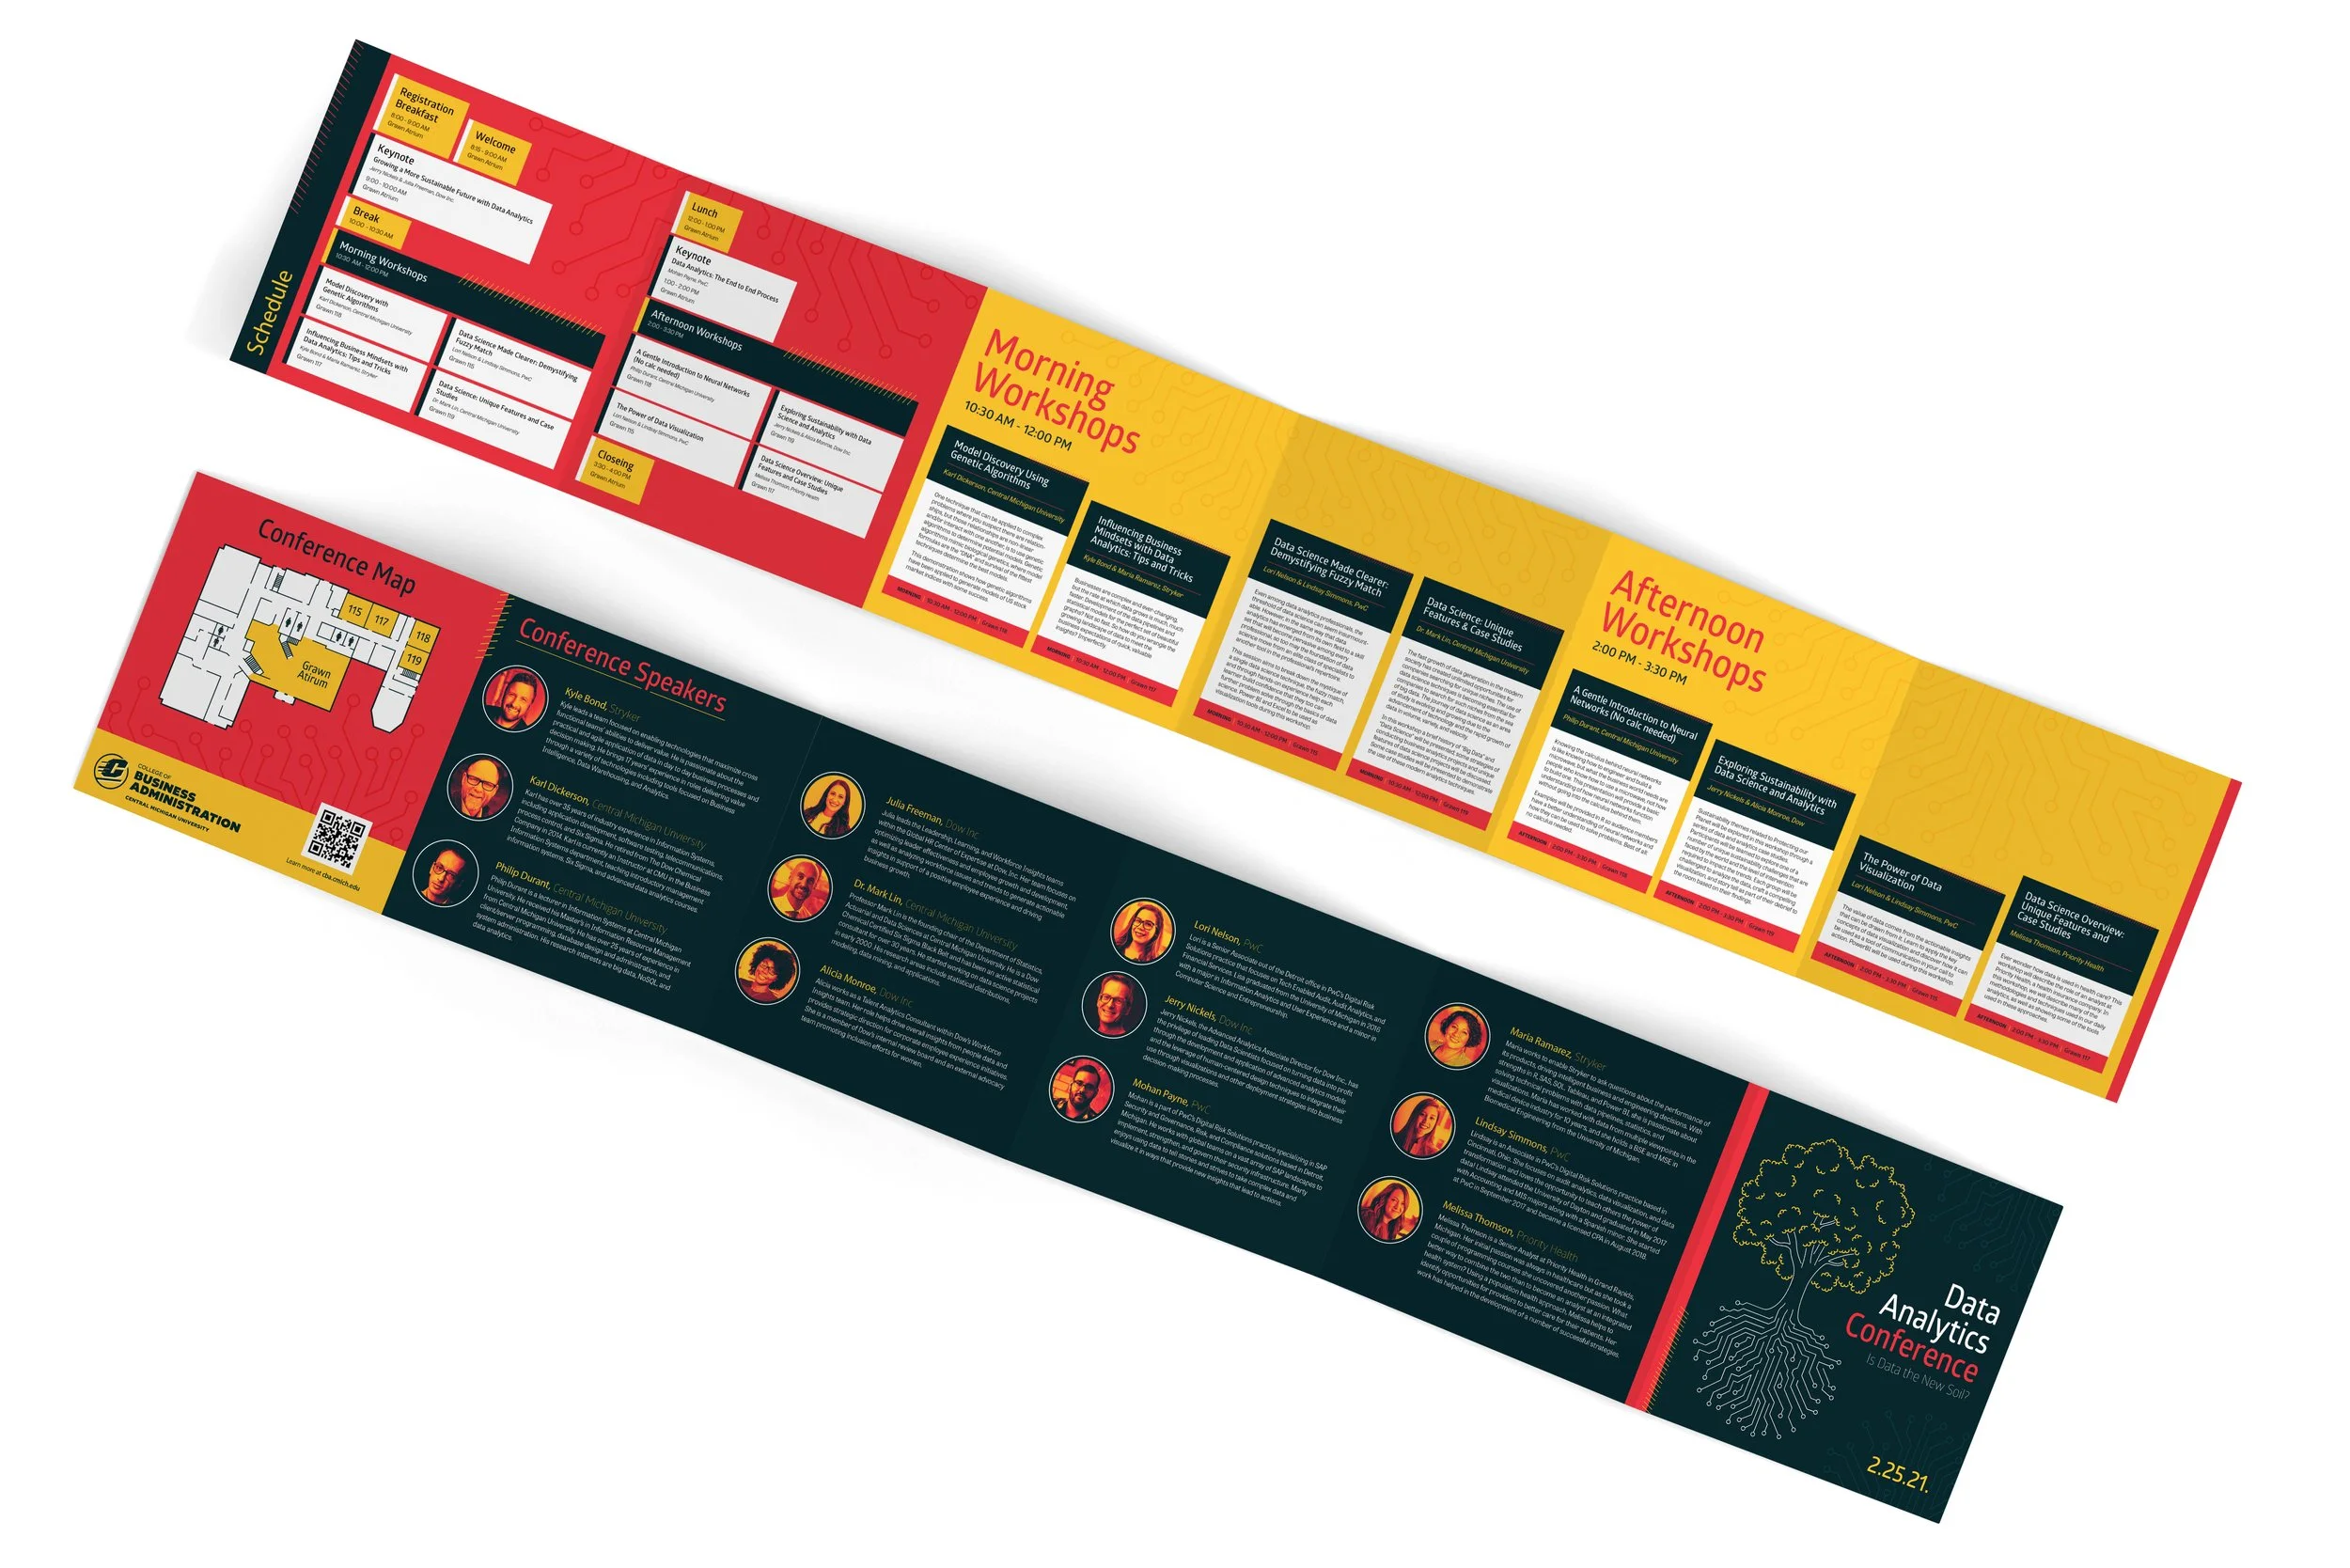
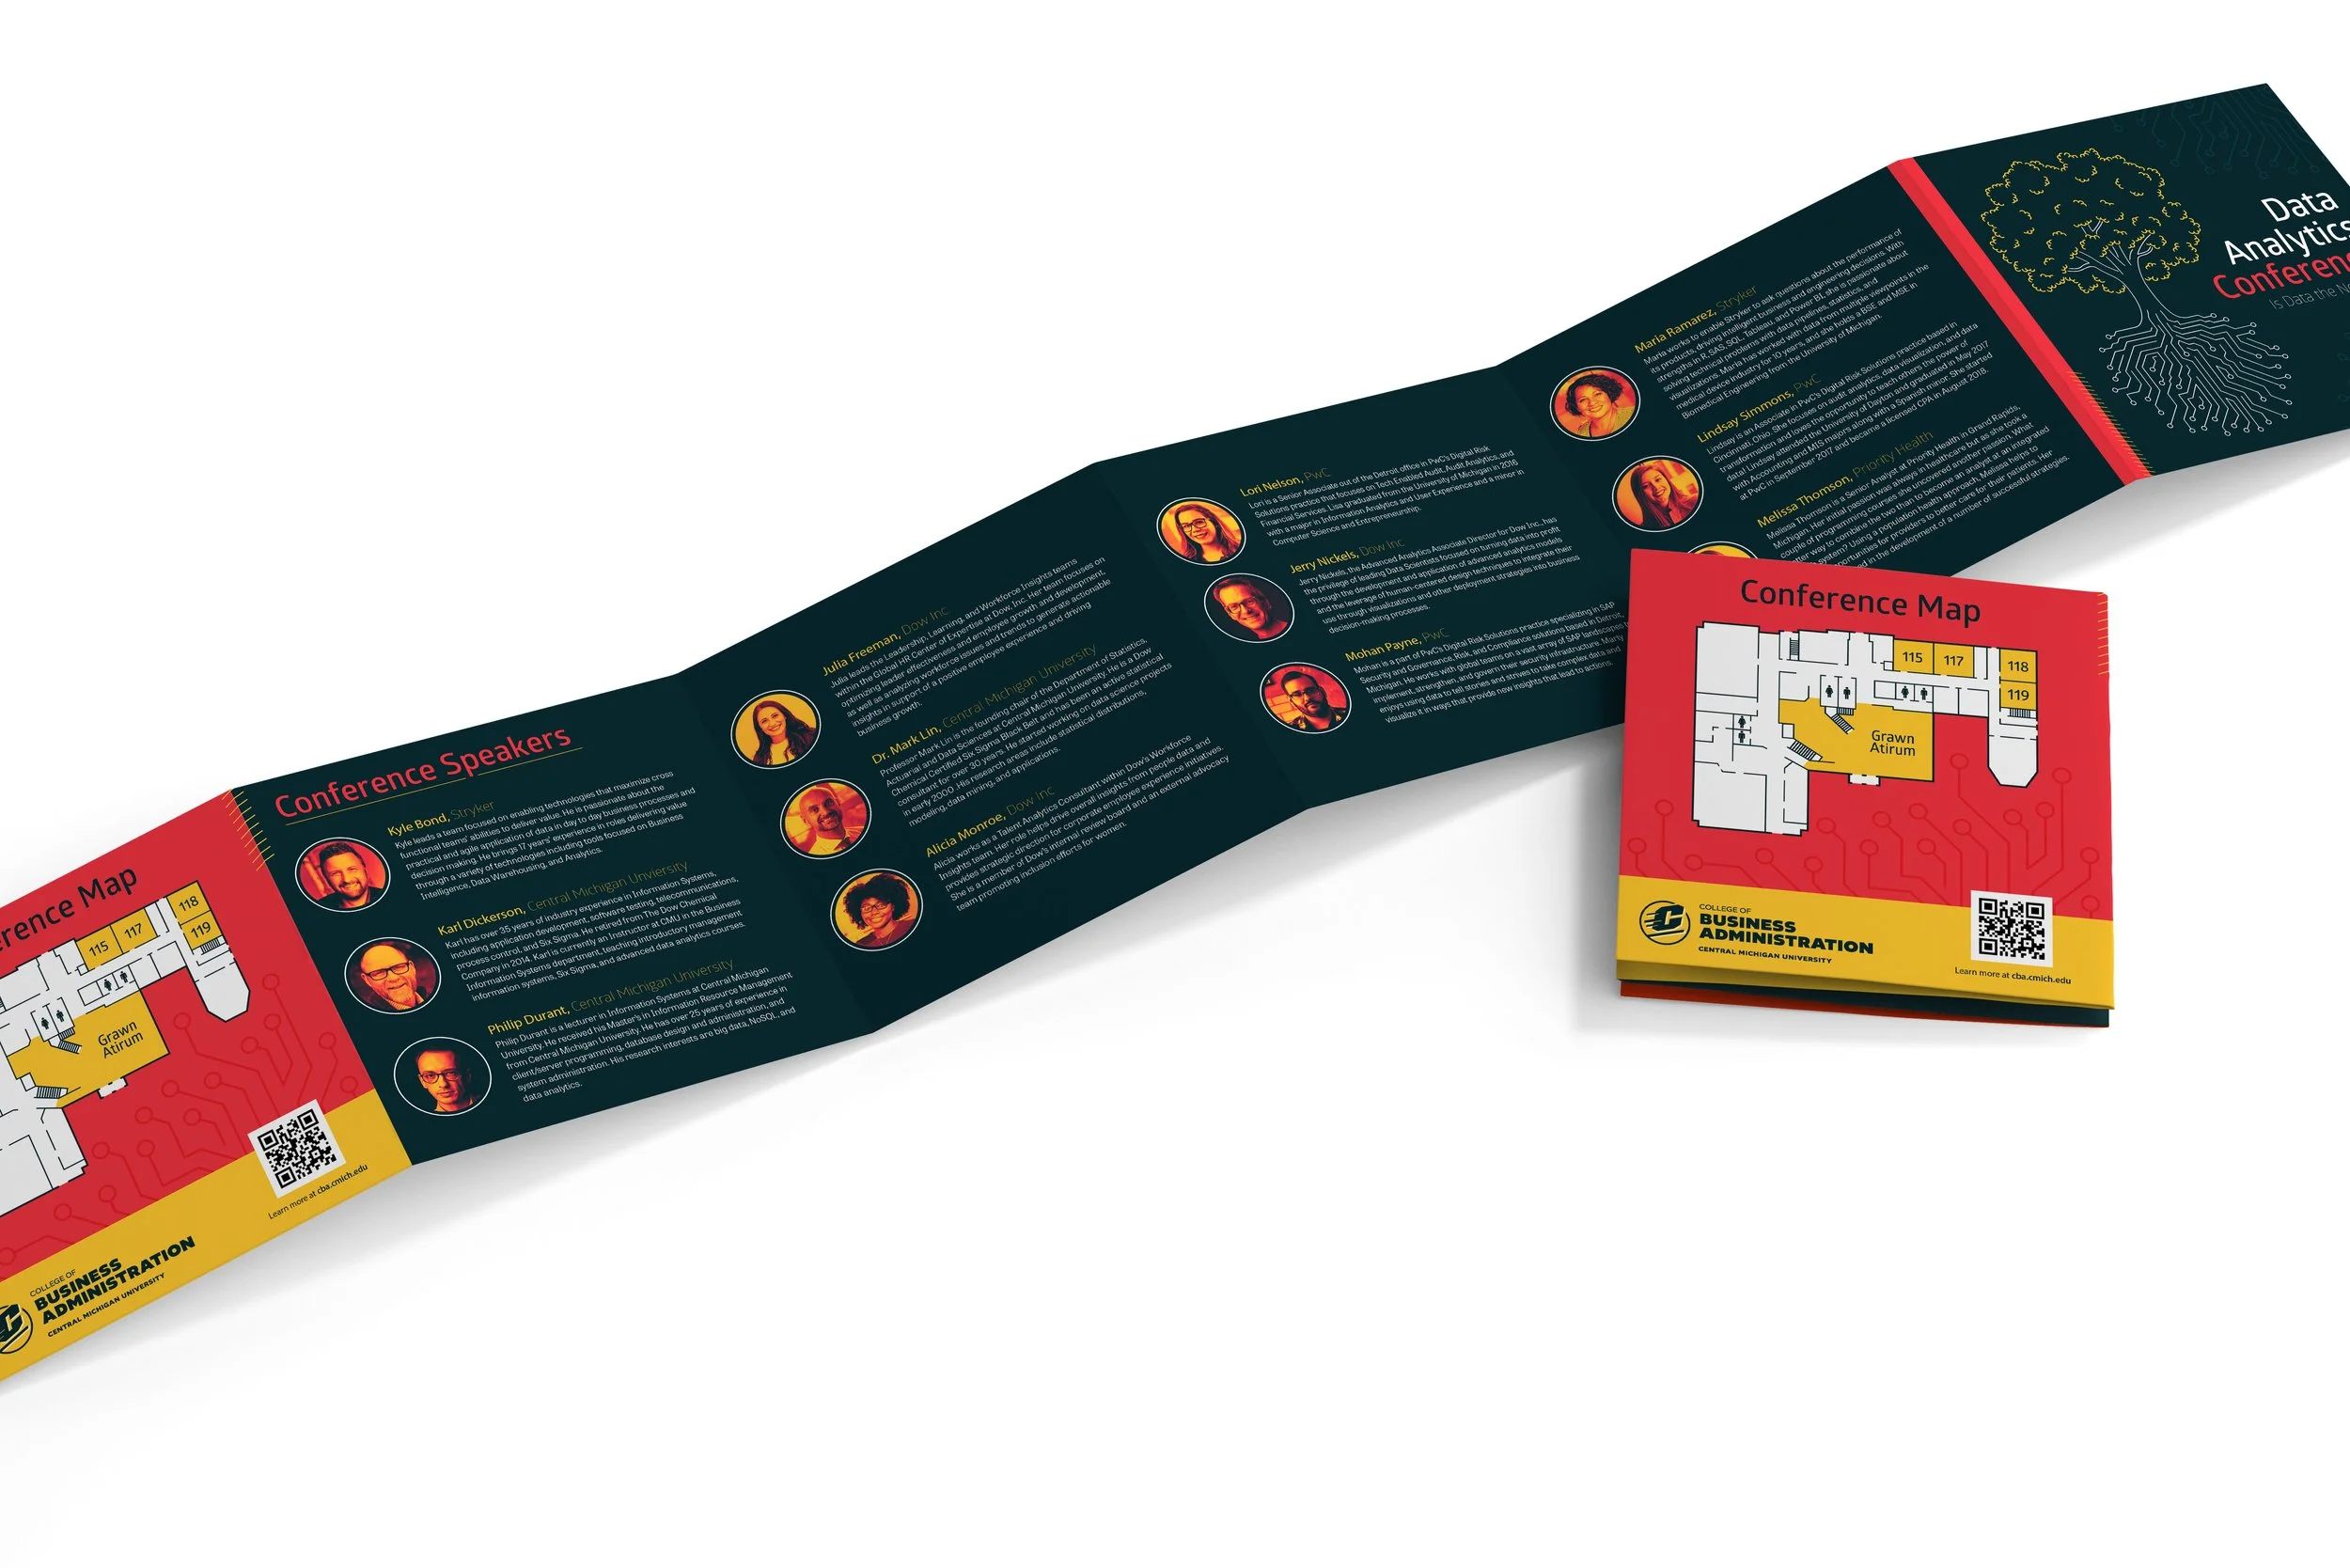
For the conference program, I decided to make a square six-fold brochure. Attendees could flip through the program as a booklet or unfold it for extensive reading. Important information, such as the schedule, is featured on the first page when read like a book. Session summaries are on the following pages. The back cover features a map to help attendees locate their sessions, and speaker bios are on the back inside pages.


